Stratrix: A Bold Trading Analytics Dashboard UI
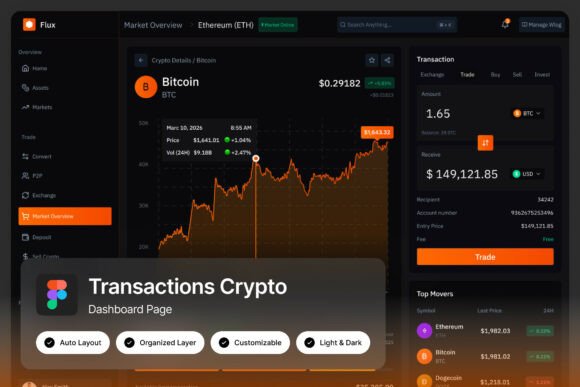
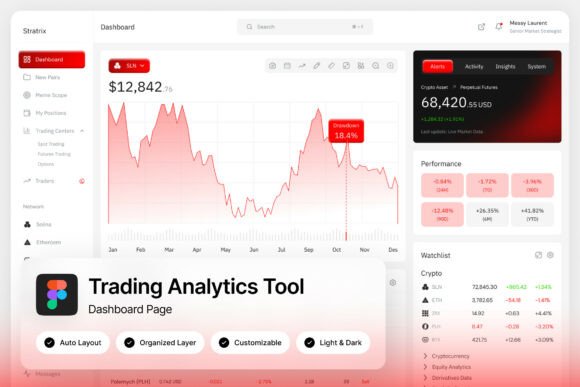
At its core, Stratrix is built for performance. The dashboard features two high-quality admin screens at a crisp 1440×1024 px resolution, providing a pixel-perfect foundation for your projects. The layout intelligently organizes a wealth of information, including detailed area charts, real-time profit/loss metrics, concise trade summaries, and broad market overview panels. This thoughtful arrangement ensures that critical data is immediately accessible, helping users make informed decisions without sifting through clutter.
Designed for Creative Flexibility
One of the standout aspects of this design asset is its exceptional customizability. Delivered as a fully editable Figma file, Stratrix empowers designers to tailor every element to their specific brand identity. The layers are well-organized, named, and grouped logically, which drastically streamlines the editing process. Whether you need to adjust the color palette to match a corporate brand, swap out fonts, or reconfigure data panels, the structure is built to accommodate your creative vision seamlessly.
The inclusion of both light and dark mode interfaces offers tremendous versatility. This feature allows you to adapt the dashboard's appearance to different user preferences or application environments, enhancing usability and modern appeal. Furthermore, the use of free Google Fonts ensures that the typography is both stylish and accessible, removing any licensing hurdles and simplifying the handoff to development teams.
Practical Applications and Use Cases
While its primary purpose is for trading platforms, the design principles within Stratrix can inspire a wide range of projects. Consider how its high-density data layout and clean modern typography could inform:
- Fintech and SaaS Platforms: The most direct application is in building admin dashboards for stock trading apps, cryptocurrency exchanges, or portfolio management software.
- Data-Heavy Web Design: The panel-based layout and chart styles can be adapted for business intelligence tools, analytics websites, or financial reporting modules.
- Brand Identity and Presentations: The bold color scheme and premium feel can inspire logo design, pitch decks, or marketing materials for tech startups, conveying a sense of innovation and reliability.
- Editorial and Social Media Graphics: The striking visuals could be used to create engaging infographics, social media posts, or article graphics that explain market trends or financial data.
Tips for Choosing and Implementing This Design
When integrating a resource like Stratrix into your workflow, a few practical steps can maximize its value. First, always test the layout with your own data sets to ensure readability and hierarchy remain intact. The balance between chart density and white space is crucial. Second, consider the mood of your project. The bold red accents convey energy and urgency, which is perfect for active trading, but may need to be toned down for more conservative financial applications.
Font pairing is another key consideration. While the included Google Fonts work well together, you might explore pairing the primary sans-serif typeface with a complementary serif or script font for headings or marketing materials to add a unique touch. Finally, always review the license and terms included in the download to ensure it fits your intended use, whether for a personal project or a commercial product.
Ultimately, choosing a well-crafted design system like this trading analytics dashboard UI is an investment in efficiency and quality. It provides a professional, visually coherent foundation that can accelerate your development timeline, ensure visual consistency across your product, and elevate the overall user experience. For any team building where data clarity and modern aesthetics are paramount, Stratrix offers a compelling and versatile toolkit to bring your vision to life.